Vinyl Record Cutting Machine
Led a team of 5 graduate students in calibration and control of the flexure x-stage of a record cutting machine, reaching 4 micron tool position resolution and cutting playable records. 2nd place at the ASPE Student Challenge.
Tools: Flexure design, Calibration, Controls, Precision engineering
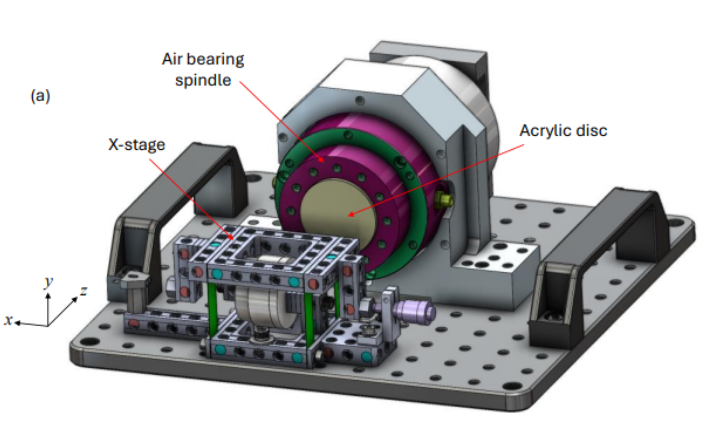
TL;DR: Led a team of 5 graduate students in the calibration and control design for the flexure x-stage of a vinyl record cutting machine, built for the annual ASPE Student Challenge in Fall 2025.
-
Achieved 4 micron cutting tool position resolution
-
Successfully carved vinyl records in the 100–2000 Hz sound range
-
Our team received
2nd place
at the ASPE Student Challenge
See the project page for the short version.
What is the ASPE Student Challenge?
Every year, the American Society for Precision Engineering (ASPE) runs a student challenge that is primarily done during the week of the annual ASPE conference. It is a good opportunity to meet fellow precision engineering students from other universities and bond while pulling an all-nighter at the start of the conference trying to get your system to work.
The 2025 ASPE Student Challenge was to write controls and align the actuator assembly and the air bearing spindle to carve an actual music record. I've been looking into making music records in cursed ways (see other people's projects for inspiration), but I haven't had much luck. So, when I heard the topic for this year's student challenge, I immediately signed up!
Chapter 1: Prep work
A couple of months before the conference, we were provided some general information about what we should expect from the competition. We were provided with the x-stage (disassembled) and a myRIO control box, and before the conference we had to:
- assemble and calibrate the x-stage to our resolution of choice to be ready to engrave a 45 second song played at 33 RPM
- make reasonable assumptions about the rest of the assembly, since we wouldn't see it until the day of the competition.
Since a large portion of this project seemed to be the design of the controls (in myRIO/LabVIEW), I recruited fellow grad students who have a lot more experience with both controls and myRIO/LabVIEW. We now had a well-rounded team with experience in precision machines, power electronics, and controls (including FPGA).
The focus of my work was to (1) set repeatability and accuracy targets and focus on the mechanical assembly and (2) learn as much as I can from the EE and controls gurus on my team.
Background: vinyl record grooves, accuracy and repeatability targets
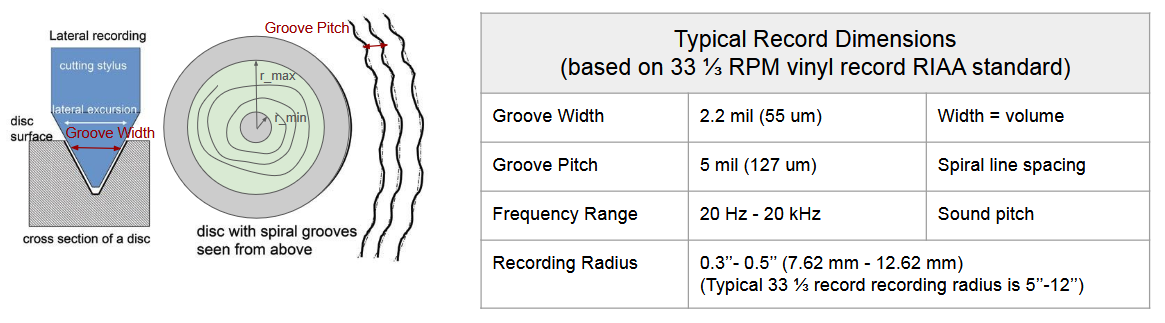
Typically, vinyl records are cut as one long spiral groove. The sound lives in the side-to-side wiggle of that groove: how far it swings sets the volume, and how fast it wiggles sets the pitch. The RIAA standard for a 33 ⅓ RPM record gives a few numbers to work from:
Groove geometry of a lateral-cut record and the typical RIAA record dimensions
Our recording radii were an order of magnitude smaller than those of a typical 33 ⅓ RPM record. The needle moves much slower near the center, so to get the same sound quality (the same frequency range with the same signal-to-noise ratio), our stage would need a significantly higher linear resolution. The other option was to intentionally reduce our frequency range.
To pick a target, we related the sound frequency to the size of the features we would have to cut. The wavelength of one sound cycle along the groove is λ = v / f, where v is the linear needle speed at playback and f is the frequency. We set the required resolution to ⅓ λ. One more twist: the record is cut at 1/10 of the playback speed, at about 3.3 RPM, and played back at 33 ⅓ RPM.
If we wanted to access the full audible range, we'd need to get 0.4 μm resolution across the full range, which we decided wasn't possible with available setup (even if we could perfectly control the system).
- mechanical setup limitations: We could measure errors up to ~0.5 μm with a laser, but we were limited with the measurement tools on the day of the competition and thus wouldn't be able to check calibration of our x-stage flexture after transporting it from Boston to San Diego.
Our playback device was a $40 record player with a built-in speaker, which likely can't reproduce much outside of 200 Hz – 2 kHz anyway. We tested a few songs filtered to that range and found that most are still quite recognizable. That set our targets:
- Position resolution: 4.4 μm (to carve frequencies up to 2 kHz)
- Pitch control: ±5.5 μm for groove spacing (about 1/10 of the groove width)
- Maximum amplitude: 55 μm (twice the amplitude has to stay below the groove pitch, or neighboring grooves would cut into each other)
Note that the actual records don't have to meet such high metrics because their cutting radius is much larger radii (we were limited to small acrylic disks due to extremely low stall torque on the air bearing spindle - more on that later). You can see our excel music record calculator to get a sense for the scaling factors.
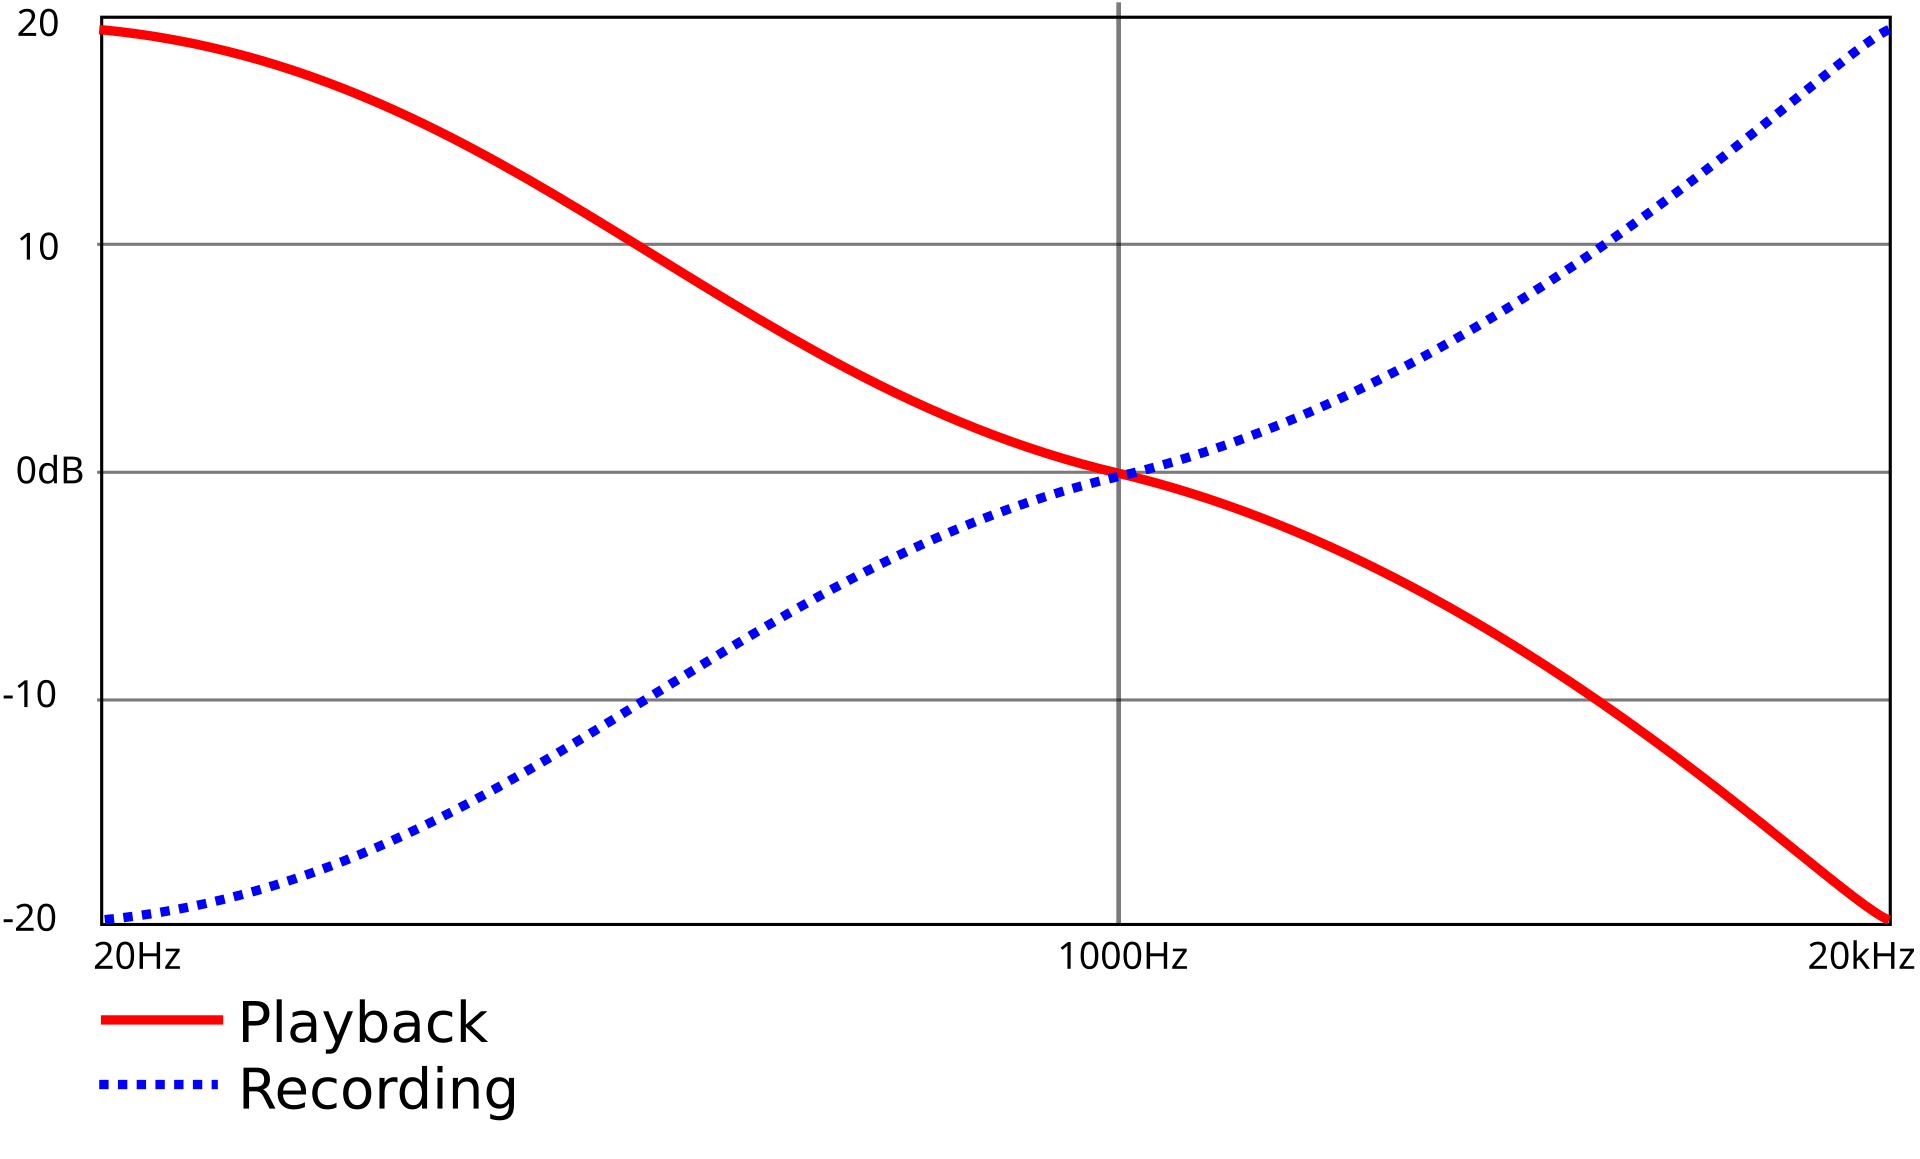
The RIAA EQ curve
Vinyl has one more trick. The RIAA standard dictates an EQ curve that cuts low frequencies and boosts high frequencies during recording, and a record player applies the inverse curve during playback. Since we were using a standard record player, applying the recording curve to our song before cutting would make it sound better on playback.
Functional requirements and error budget
We organized the design with an FRDPARCC table (functional requirements, design parameters, analysis, references, risks, countermeasures and conclusions), then built an error budget around the 4.4 μm total.
The biggest risk was everything we couldn't see. The spindle, cutting tool and the alignment between components were only revealed on competition day, so we had to leave margin for errors we couldn't measure.
Error budget table splitting the 4.4 μm total between the x-drive structure, controls and light sensor*. Most of the 4.4 μm went to the x-drive structure (85%), with 5% for controls and 10% for the light sensor.*
Cutting forces: 15 N
To estimate the load-induced error, I modeled the cutting forces from the material removal rate and the specific cutting energy of the acrylic. About 15 N seemed reasonable. At the competition, the organizers independently measured it at 10–15 N, which was a nice confirmation! Kumar, one of the organizers, even had to update the cutting tool to melt the plastic instead of cutting it, to lower cutting forces so the air bearing spindle wouldn't stall and to improve the surface finish.
Chapter 2: Calibrating the flexure
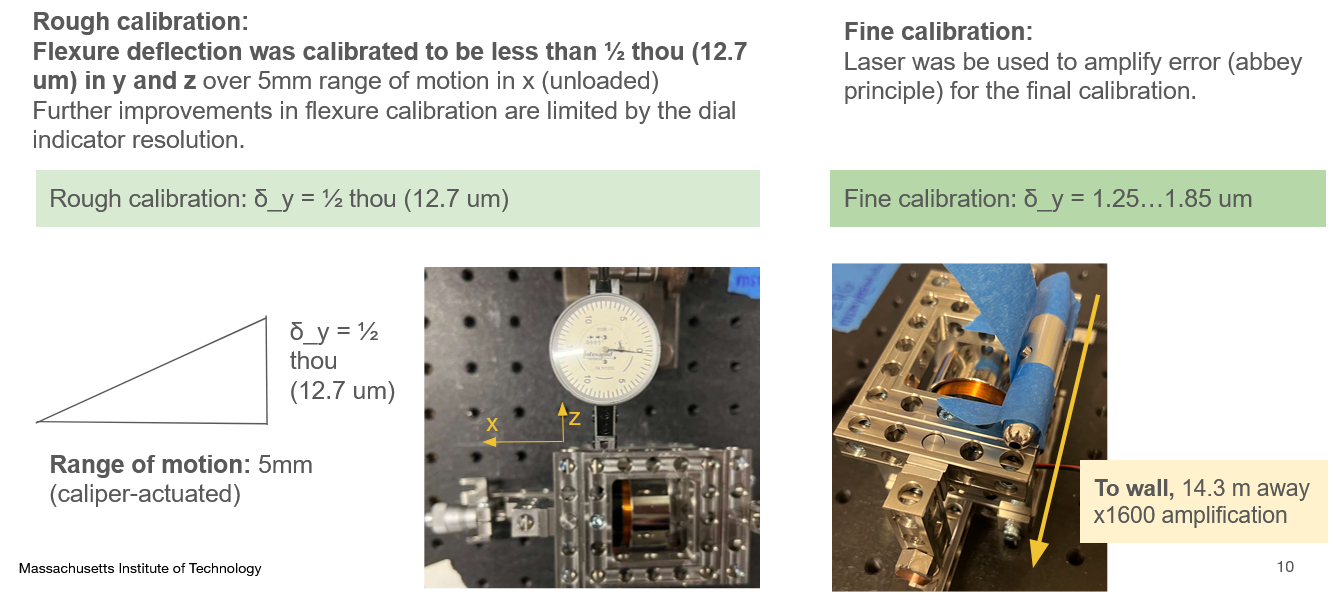
The x-stage is a flexure: instead of bearings, it moves by bending thin metal blades, which gives very smooth, repeatable motion as long as everything is assembled straight. Any misalignment shows up as parasitic motion in Y and Z while the stage travels in X.
Rough calibration. I first aligned the flexure with a dial indicator while moving the stage with a caliper. I got the deflection under ½ thou (12.7 μm) in Y and Z over the full 5 mm range of motion (unloaded). Beyond that, I was limited by the dial indicator resolution.
Fine calibration. To go further, I mounted a laser to the stage and pointed it at a wall 14.3 m away. Any small tilt of the stage gets amplified about 1600× at the wall (the Abbe principle working for us instead of against us). This got the parasitic motion down to 1.25–1.85 μm.
Chapter 3: Taming the optosensor
The stage position was measured by a reflective optosensor, which turned out to be the trickiest part of the system. It had three potential issues:
- The reading is sensitive to the sensor's neutral distance from the reflector
- The volts-vs-distance reading is nonlinear
- The signal is noisy, so the resolution might not meet spec
(We also tried adding shielding to the sensor wires, but it had no measurable effect on the noise.)
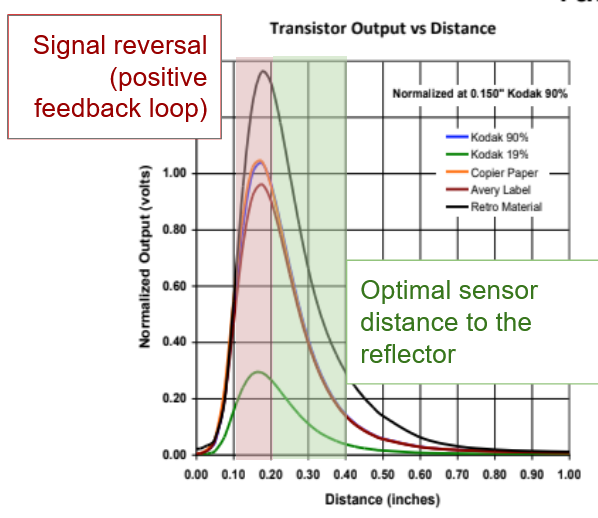
Repeatable placement. According to the spec sheet, there is an optimal range in which the sensor output is linear with distance. If the sensor sits too close to the reflector, the output reverses direction, and the controller ends up in a positive feedback loop. We adjusted the sensor until it was in the optimal position, then used a gauge block to set it to exactly that spot at the start of every experiment.
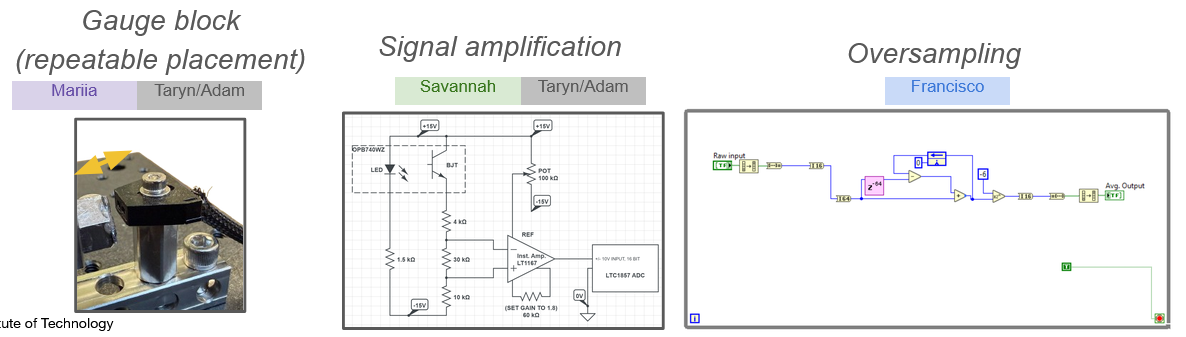
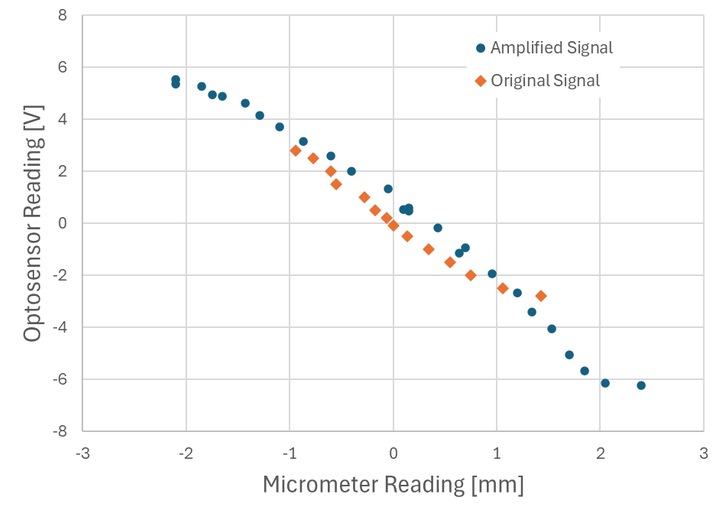
Signal amplification. The calibration curve showed nonlinearity at the extremes, which complicates control. Amplifying the signal pushed that nonlinearity out to the edges, so we only worked in the linear center. It also improved the signal-to-noise ratio, since the noise stayed the same while the signal range grew.
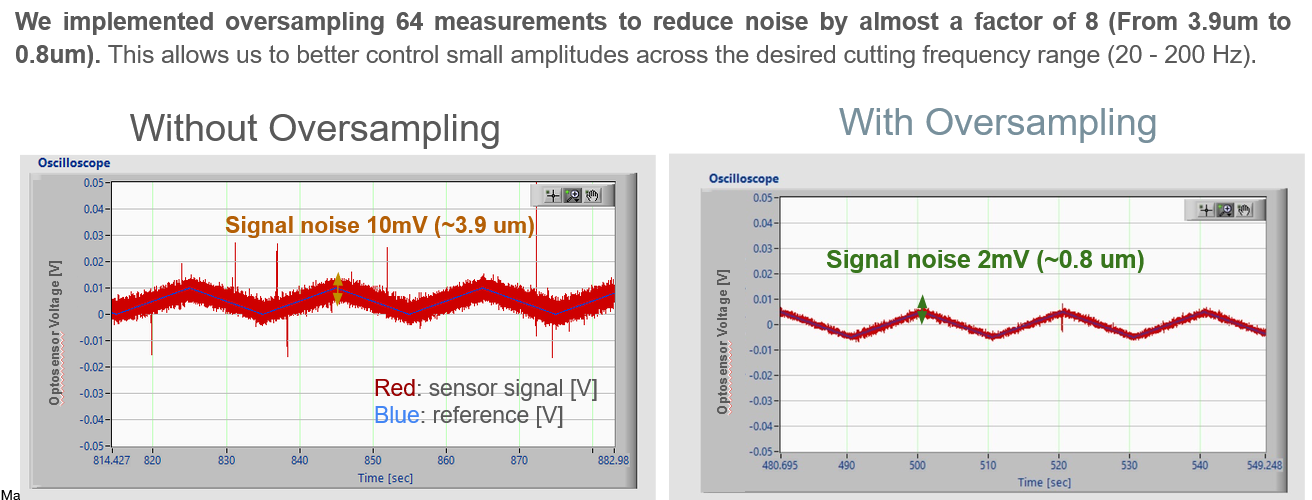
Oversampling. The myRIO can read the optosensor at up to 133 kHz, but our control loop runs at 1.6 kHz, so there is room for up to 83 samples per loop. Averaging 64 measurements per loop reduced the noise by almost a factor of 8, from about 3.9 μm to 0.8 μm, comfortably inside our budget.
Chapter 4: Controls
This is where I learned the most from my teammates.
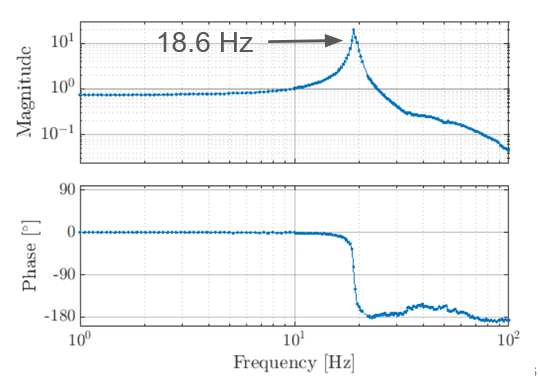
System identification. To design the controller, we first measured the plant: the voice coil and flexure stage, from command voltage to sensor reading. The challenge specs gave a natural frequency of 17 Hz and a damping ratio of 0.09, so we modeled it as a second-order system. A frequency sweep showed a resonance at 18.6 Hz, which matched the model well.
Measured Bode plot of the x-stage with a resonance at 18.6 Hz
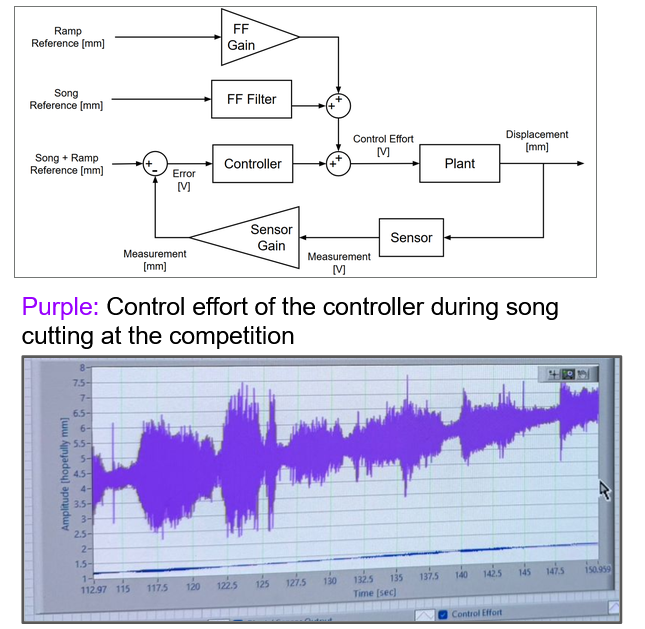
Controller design. To follow the slow triangle wave while rejecting disturbances, we used a PID-style controller: a lead compensator (zero at 15 Hz, pole at 158 Hz) and an integrator (lag compensator with a pole at 0 Hz and a zero at 0.8 Hz). The stage tracked the ±2.5 mm triangle wave very closely.
Turning a song into a reference. For the competition, we cut 30 seconds of a song. Because the spindle cuts 10 times slower than the turntable plays back, we resampled the song to 16 kHz, which is 10 times the 1.6 kHz loop rate, and applied the RIAA recording filter in Audacity.
Feedforward. Music is a much higher frequency input than a triangle wave, well above the stage's resonance, so feedback alone can't keep up. We added a feedforward filter that is the inverse of the flexure stage's frequency response (using m = 0.5 kg, b = 10.9 kg/s and k = 5000 N/m from the spec), so the controller "pre-distorts" the command to cancel out the stage dynamics.
Feedforward plus feedback block diagram and the controller effort recorded during the song cut
We also planned for a few more risks: excessive PID gain causing oscillations (we capped the gain at a modeled and tested safe limit, with a physical current limit as backup), flexures getting bent in shipping (careful packing), the audio signal saturating the voice coil if too strong, and an inaudible recording if too weak.
Chapter 5: Competition night
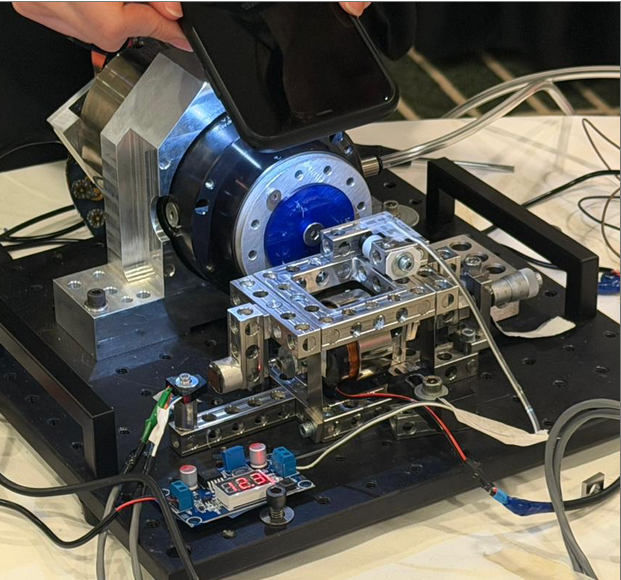
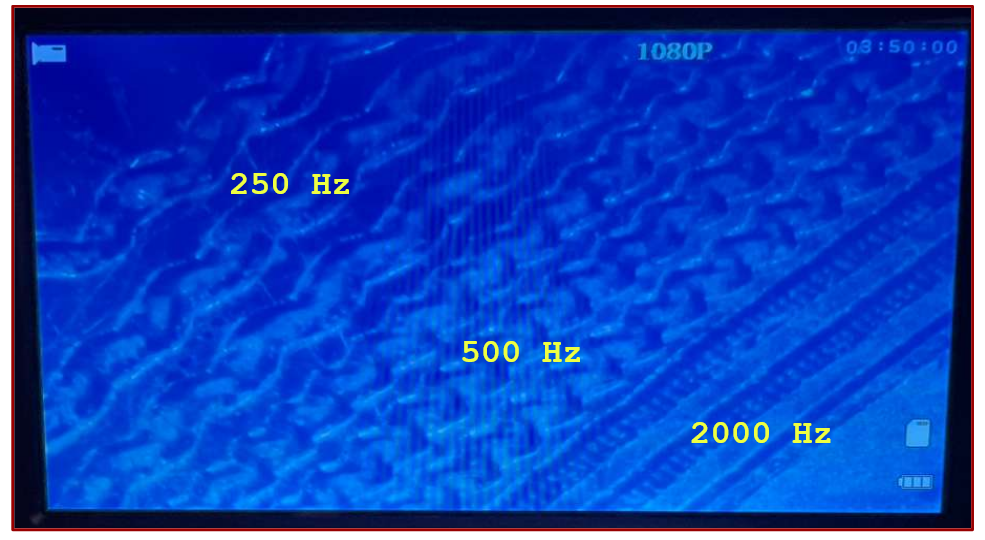
On November 3, at the ASPE conference in San Diego, every team finally got the rest of the setup: the air bearing spindle, the cutting tool and the base. We had 6 hours, from 8 PM to about 3:30 AM, to integrate our x-stage hardware and software with it, then cut 45 seconds of a song of our choice plus 15 seconds each of 250 Hz, 500 Hz and 2000 Hz sine waves.
Judging was qualitative (how recognizable is the song?) and quantitative (how close are the sine waves to the target frequency?).
The x-stage integrated with the air bearing spindle during the song cut
It worked! The song was recognizable on playback, and under a microscope you can see the three test tones as grooves with very different wiggles. We were one of two teams whose songs were recognizable to the ASPE conference audience :)
You can listen to the songs here:
- Our recording (Google Drive link)
- Original: Velvet Underground - After Hours Chorus (Youtube link)
And our team got 2nd place!
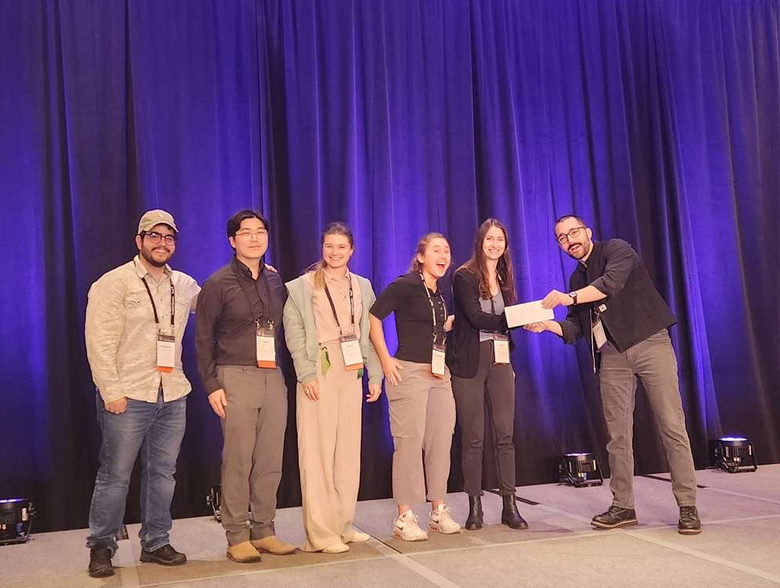
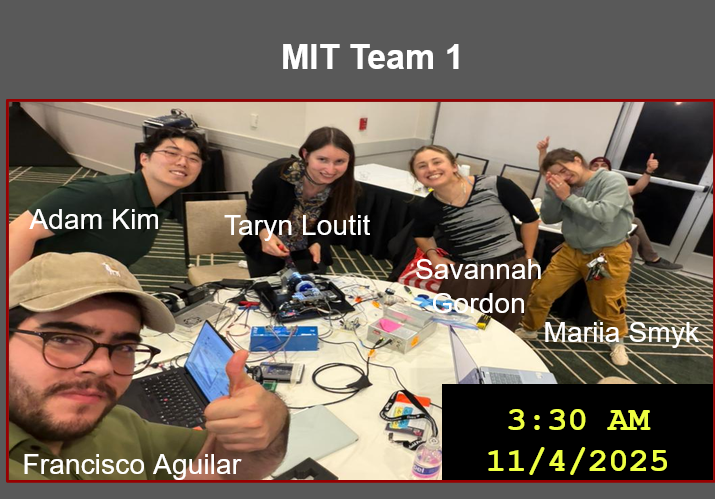
Chapter 6: What's next, adding damping
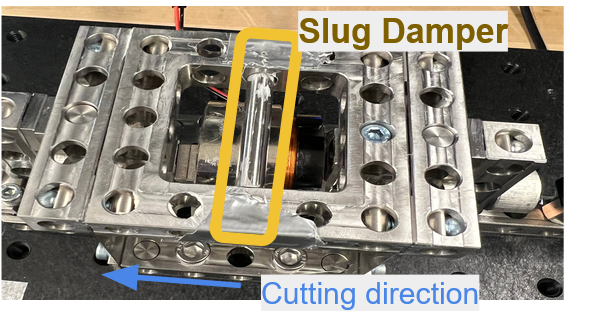
Slug Dampers! Inspired by their applications in Gas-Liquid Cylindrical Cyclone (GLCC).
Closed-loop control at high frequencies (above 100 Hz) was limited by how high we could push the controller crossover frequency. That comes down to (1) the magnitude dropping off at high frequencies and (2) how close the phase gets to -180°. I wanted to know whether adding damping would allow a higher crossover frequency, and so better record cutting.
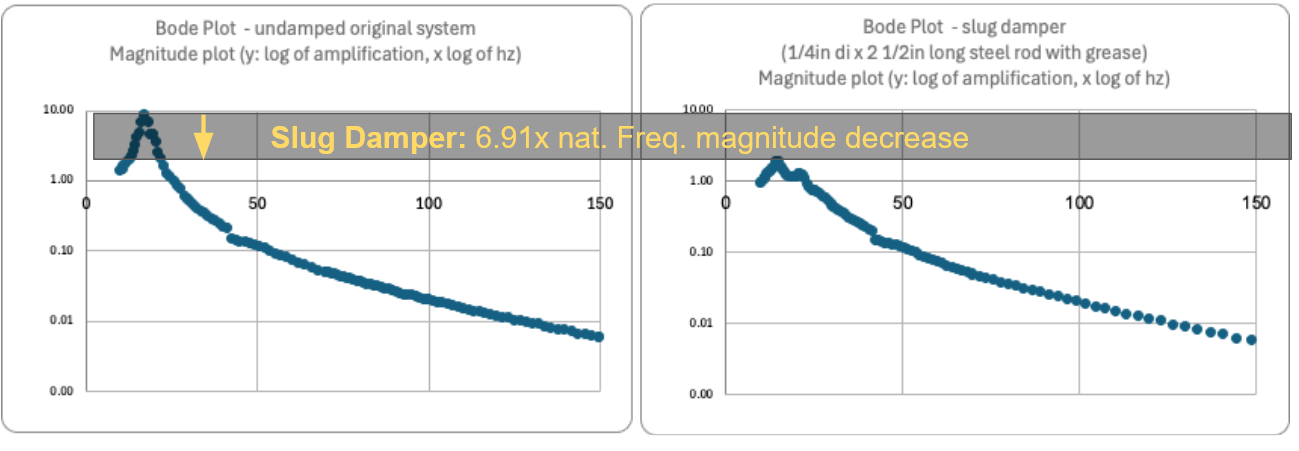
To test it, I inserted greased rods of different lengths (½″ and 2 ½″) and materials (brass, steel and Delrin) perpendicular to the cutting direction as "slug dampers," then ran a frequency sweep for each. Only the ¼″ diameter, 2 ½″ long steel dowel made a real difference, cutting the resonance peak magnitude by 6.91×. The others had negligible effect.
Bode magnitude plots of the stage without and with the slug damper
We didn't have time to test how damping affects cutting during the competition. We've been working with the organizers to get all of the parts shipped to MIT to test it in house, but they didn't arrive before our report deadline.
Who did what
This was very much a team effort:
-
Mariia (me):
flexure and optosensor characterization and calibration, damping testing
-
Francisco:
optosensor oversampling, initial PID controller, integrating the song into the NI code
-
Savannah:
electronics debugging, figuring out the roles and limits of the provided PCBs, initial discovery of the optosensor nonlinearity and position sensitivity
-
Taryn and Adam:
advanced controller implementation, frequency sweep code in NI for plant characterization
Thank you
Thank you to the ASPE Student Challenge organizers, especially Kumar and Luis, for their dedication to making this challenge possible and for working with us on shipping the parts to MIT after the challenge. Thanks also to Prof. Slocum, Prof. Trumper, and the other MIT team in the challenge for their insights and support.